
The ErdaGIS framework system
ErdaGIS can be characterized as follows:
System requirements
- Operating system: Windows 95/98/ME, Windows NT/2000 Xp W7 W8
- Graphical application: Bentley MicroStation 95, SE, J or GeoOutlook
- Database management application: Microsoft Access or ORACLE
- Network: Windows, Novell
Data stored in the system
- 2D vector files
- 3D vector files
- Raster files transformed to map
- Data describing various features
- Photographs, videos, documents, spreadsheets, hyperlinks or anything that can be displayed in a Windows application
Projects

Data describing ErdaGIS are stored in special DBMS tables, the editing of which will prepare for the required task.
The user is entitled to define:
- files (vector and raster files)
- layers
- graphical elements (lines, cells)
- Tables containing descriptive data
Arbitrary number of various projects with customized user interface can be held on the same computer.
The project manager is used to create, start and manage projects.
The User Interface
The user interface of ErdaGIS is written in Hungarian and in English. The user can choose commands from menus or simply by clicking icons. Several parts of a graphic (e.g. a zoomed-in picture and the whole area) can be displayed on the screen at the same time.
Forms
The user can attach descriptive data to graphical elements (lines, cells etc.) and use different colours to separate various fields. Using ErdaGIS, the user can also create insets within forms (e.g. part I, II and III of a proprietorship register of land register). Using WinWord, the user can edit the form for printing in rich text format.
Editing and printing graphics

You can print graphics using the default printer installed to Windows. Once the scale has been given and the area has been selected, printing starts automatically.
To edit graphics, you can use the original MicroStation commands as well as your own customized ones.
Geodetic measurements
Distance, projected distance, polar, measuring surface areas
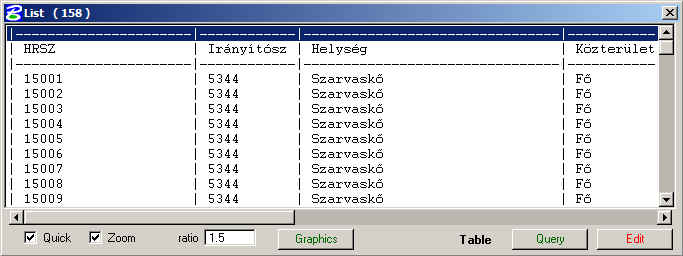
Querying descriptive data
In ErdaGIS you can search for data using the SQL 'select' command. To make the creation of the SQL queries easier for the user, the system provides the dialog box shown below:

The selected data can be displayed in a list or in an Excel table. On pointing to an item in the list, the view moves to the selected element in the graphics.
Displaying data
Using various techniques, ErdaGIS supports the visualization of data.
Preparing thematic maps
It is possible to create thematic maps, where surfaces can be coloured based on descriptive data. Several conditions can be assembled. In the figure on the left the surface area of the fields are as follows:
Up to 500 m2 yellow
500 - 2000 m2 green
Over 2000 m2 blue
Displaying distributions
You can create surfaces based on the values of descriptive database fields interpreted as altitude data, e.g. the area distribution of buildings with data from the above map.
Visualization
 To promote work, it is often necessary to display the following additional data on the screen:
- The display of marker circles on points
- The display of legends to scale
- The display of the content of the description data field
- The display of coordinate Z
- The display of scale
- Setting magnification by scale
- Méretarány szerinti nagyítás beállítása